Team
2 PDs, 1 UXR, 1 PM, 3 Engineers
Role
Enterprise Product Designer
Time Stamp
October 2025 - Present

UNIFYING RISK WORKFLOWS
Project
A Payments Risk Operations Experience for Plaid
esigned a payments risk experience for Plaid that connected monitoring, investigation, and handoff workflows from signal to resolution while preserving context across every step.
D
Cohorts, time windows, and event definitions were held consistent across the before and after periods, so the change reflects the redesign rather than seasonality or instrumentation. The underlying figures sit under client agreement; the measurement design is mine to explain.
Overview
Operations leads and risk analysts worked from the same payments data and needed almost opposite things from it.
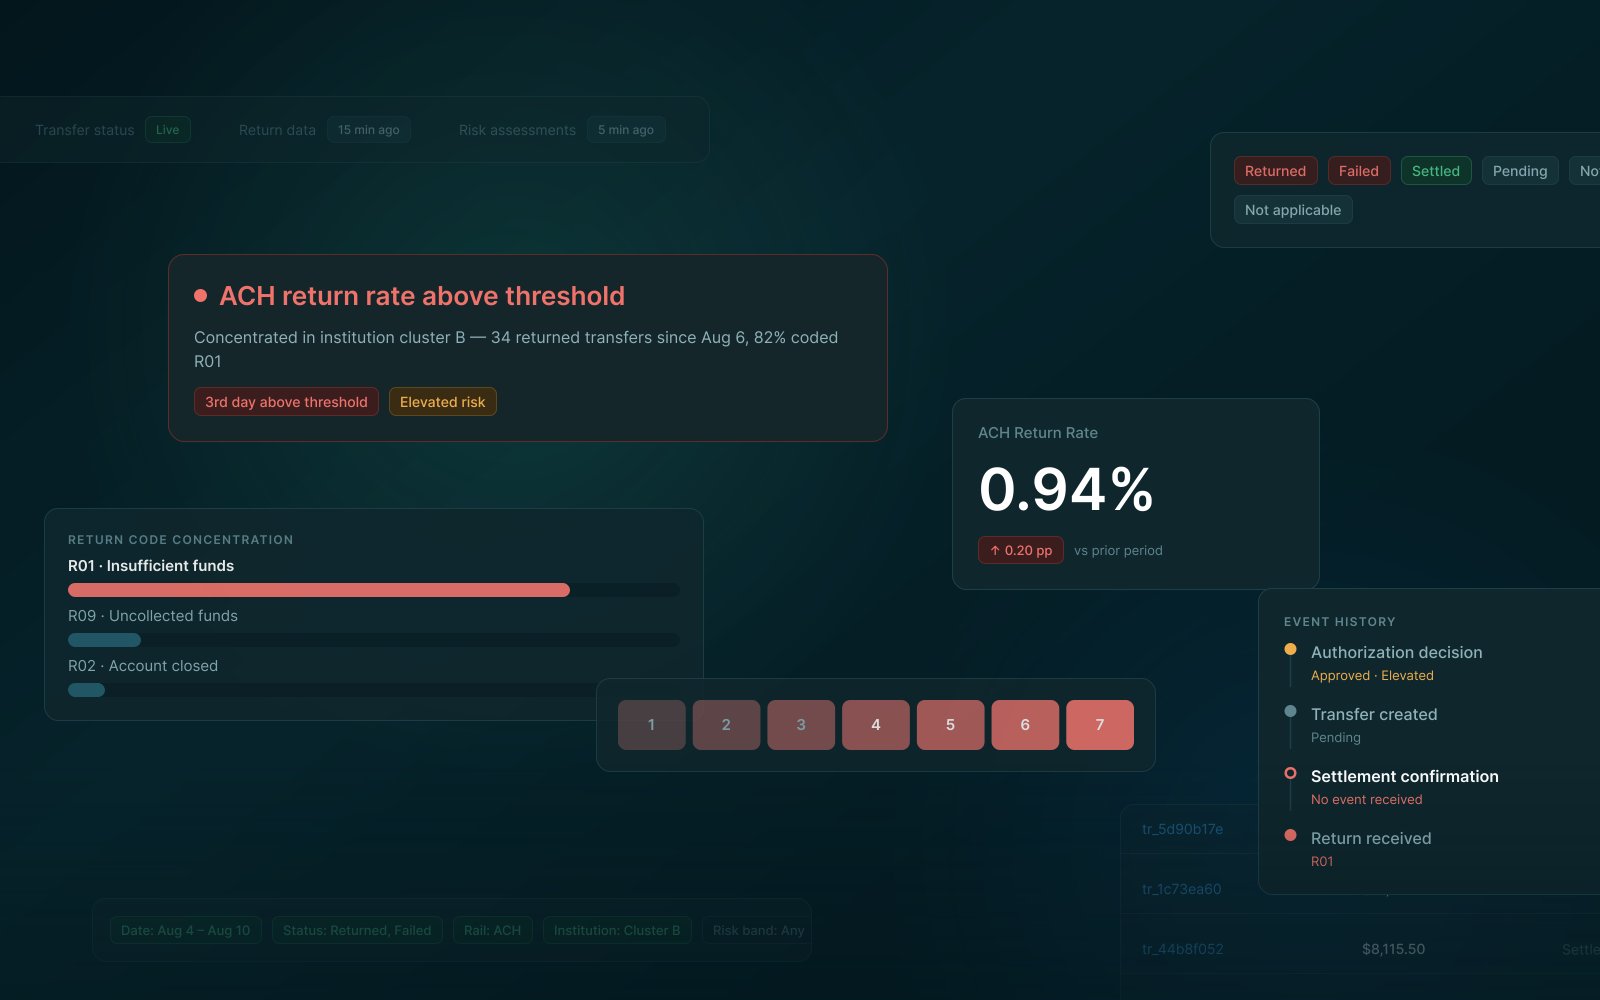
Plaid's payments operations and risk teams needed different levels of visibility into the same transaction data. Operations leads needed to quickly identify changes in payment health, while risk analysts needed deeper tools to isolate, investigate, and act on exceptions.
I designed a connected payments risk experience that carried investigation context from monitoring through handoff and transaction-level analysis, reducing repeated work while making payment status, risk, and data freshness easier to understand.
My Role & Goal
As the Enterprise Product Designer, I worked on end-to-end experience across payments monitoring and risk investigation, from research and workflow definition through interaction design, prototyping, validation, and developer handoff. I partnered with Product, Engineering, and Data/Risk stakeholders to design role-based dashboards, persistent filtering and saved views, transaction drill-downs, exception handoffs, asynchronous system states, and reusable patterns aligned with the design system.
Problem
Three failures showed up in every discovery conversation.
Investigation context was lost during handoff
By the time an operations lead identified an issue, they had already narrowed it by date range, payment status, rail, and institution. That context did not consistently carry into the analyst workflow, forcing analysts to recreate the same segment before they could investigate.
Drill-downs interrupted the investigation
Opening transaction details often meant moving away from the filtered view that surfaced the issue. Returning to the investigation required analysts to restore their previous context, adding repeated setup to an already complex workflow.
System state was not always clear
Fresh and stale values were difficult to distinguish, and unavailable risk information could be interpreted as a valid low-risk state. In a payments workflow, users needed to understand not only the value being shown, but how current and complete that value was before acting on it.
Findings
Filters were part of the investigation, not just a way to navigate data
I combined interviews across payments operations, risk and fraud operations, product operations, and implementation with survey input from practitioners involved in payment monitoring and investigation.
Leads needed signals they could act on
A metric alone was not enough. Operations users needed thresholds, comparison periods, trends, and freshness context to determine whether a change required attention.
Filter combinations represented an investigation hypothesis
Analysts repeatedly used combinations of date, status, institution, payment rail, and other dimensions to isolate an issue. Losing those filters meant losing part of the investigation itself.
Data freshness directly affected trust
Users consistently wanted to know whether the information they were reviewing was current before using it to make an operational decision.
The investigation was not centered on a single transaction. It usually began with a segment of activity that described the suspected issue. Treating that segment as reusable context connected monitoring, drill-down, assignment, export, and escalation into one continuous workflow.
Principles
Four principles guided the experience
Preserve context across the workflow
Filters, date ranges, and selected segments should carry into drill-downs, assignments, exports, and reports instead of requiring users to recreate them.
Support different depths with a shared language
Operations leads and analysts needed different levels of information density, but statuses, terminology, alerts, and interaction patterns should remain consistent across both experiences.
Make system state explicit
Loading, partial data, stale information, failed requests, unavailable assessments, and restricted actions should each communicate clearly what the system knows and what the user can do next.
Add depth without losing the original view
Analysts should be able to inspect an individual transaction while keeping the filtered table and investigation context available behind it.
Operations
Designed for quick monitoring, clear prioritization, and confidence in the data being shown.
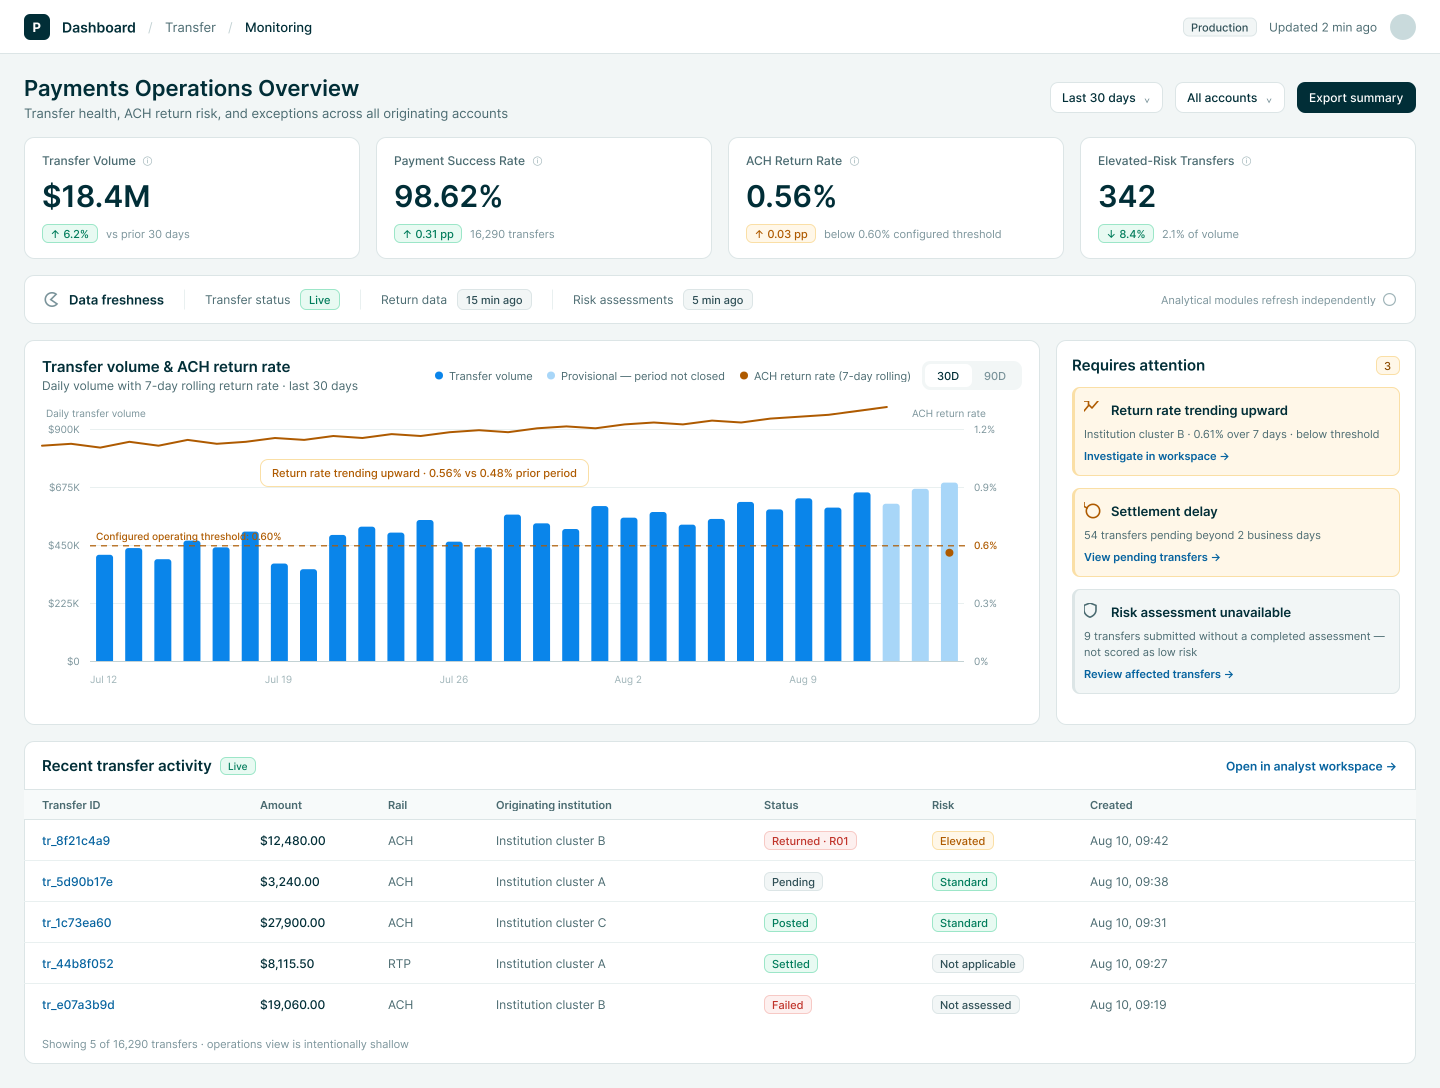
Nothing requires attention
The overview combines four key payment-health indicators with comparisons and configured thresholds so users can understand both the value and its significance. Data freshness is also shown explicitly because different parts of the dashboard may update at different times.

Third consecutive day above threshold
When the ACH return rate exceeds its configured threshold, the exception becomes the primary focus of the screen. The trend highlights the affected period and provides clear next steps to investigate or assign the issue. Incomplete periods are visually distinguished so users do not mistake partial data for an actual decline.
The handoff
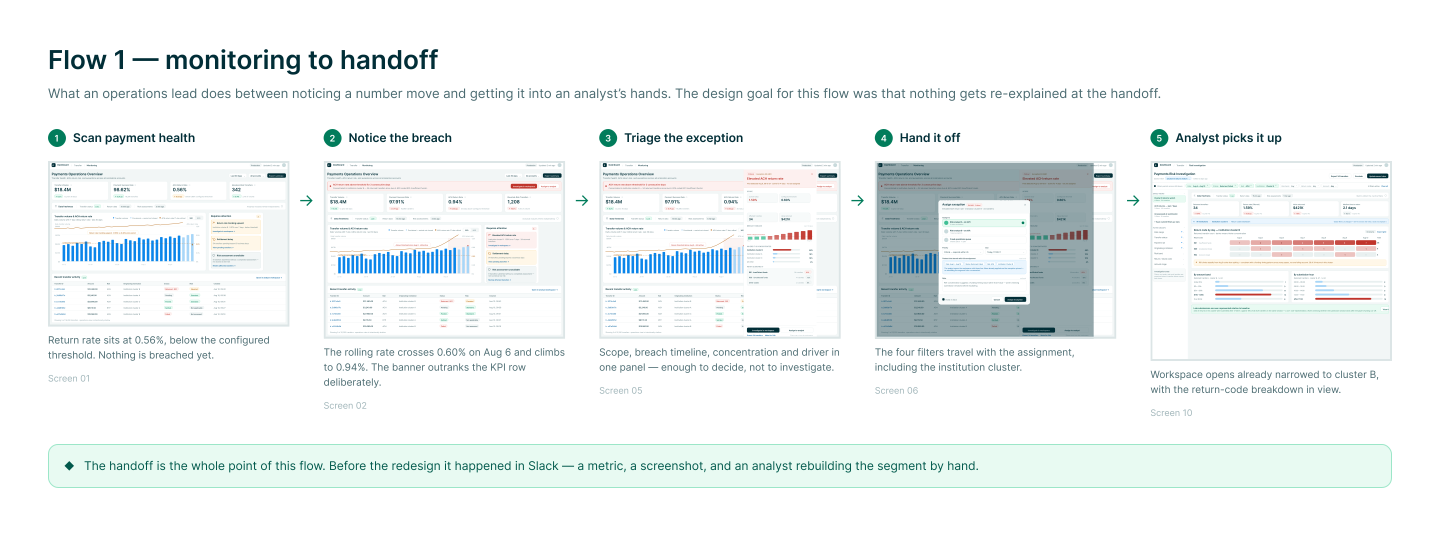
I designed the transition from monitoring to investigation so that the context already discovered by one user would not need to be recreated by another.
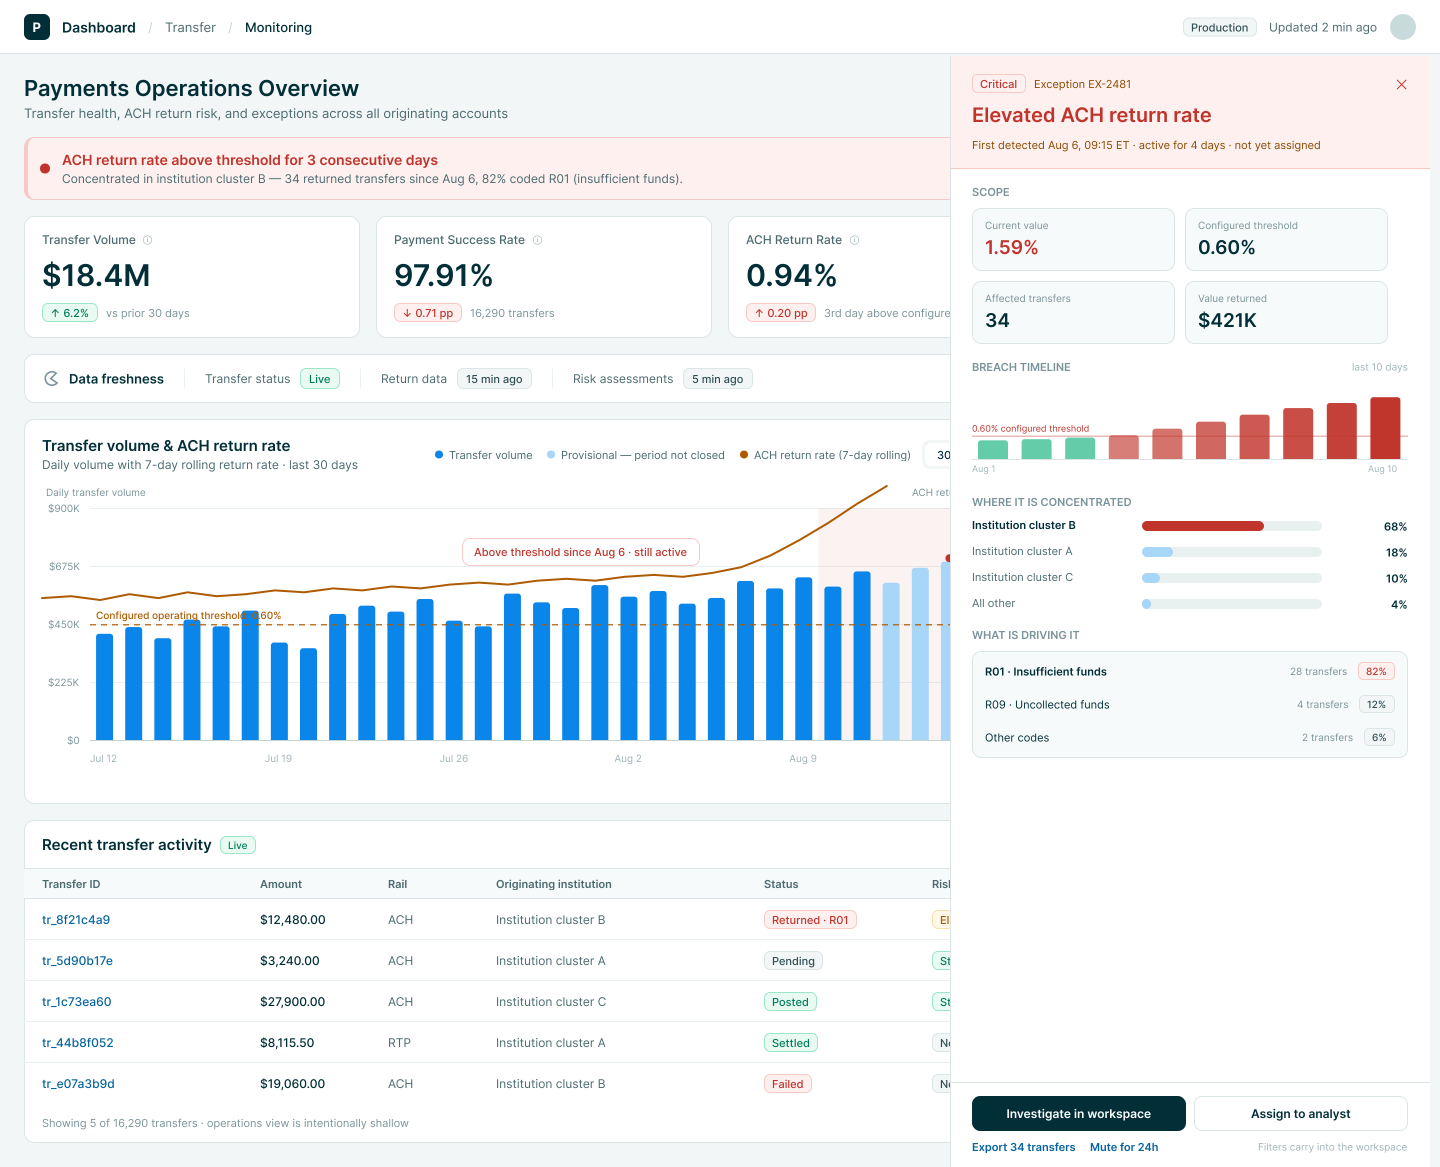
Enough context to decide what happens next
The triage view summarizes the scope of the issue, breach history, concentration, and primary driver. It gives the operations lead enough information to determine whether the issue requires deeper investigation without duplicating the analyst workflow.

Context travels with the assignment
Date range, status, payment rail, and institution context are automatically included with the assignment. The analyst receives the same scope the operations lead used when identifying the issue.

The analyst starts from the identified segment
Opening the assignment takes the analyst directly into the relevant investigation view with the same filters already applied and the appropriate breakdown visible. The workflow continues from the lead's analysis instead of restarting from a default dashboard.
The redesign turned the investigation context itself into the handoff. Instead of communicating an issue separately and asking another user to reconstruct it, the relevant segment moves directly into the next stage of the workflow.
Analyst workspace
Designed for deeper investigation while keeping the analyst's working context intact.

Evidence before deeper filtering
Global filters remain visible while concentration analysis and transaction-level results help analysts understand which segment is contributing most to the issue. This gives them evidence to refine the investigation rather than requiring them to start from a blank filter state.

Counts before applying a filter
Institution options include the number of matching returned transfers and the result count updates as the analyst changes the selection. This allows users to understand the impact of a filter before committing to it.

Transaction detail without leaving the investigation
Selecting a transaction opens a contextual drawer while keeping the underlying table, filters, and scroll position intact. Event history is shown in lifecycle order, and missing events are represented explicitly rather than appearing as unexplained gaps.
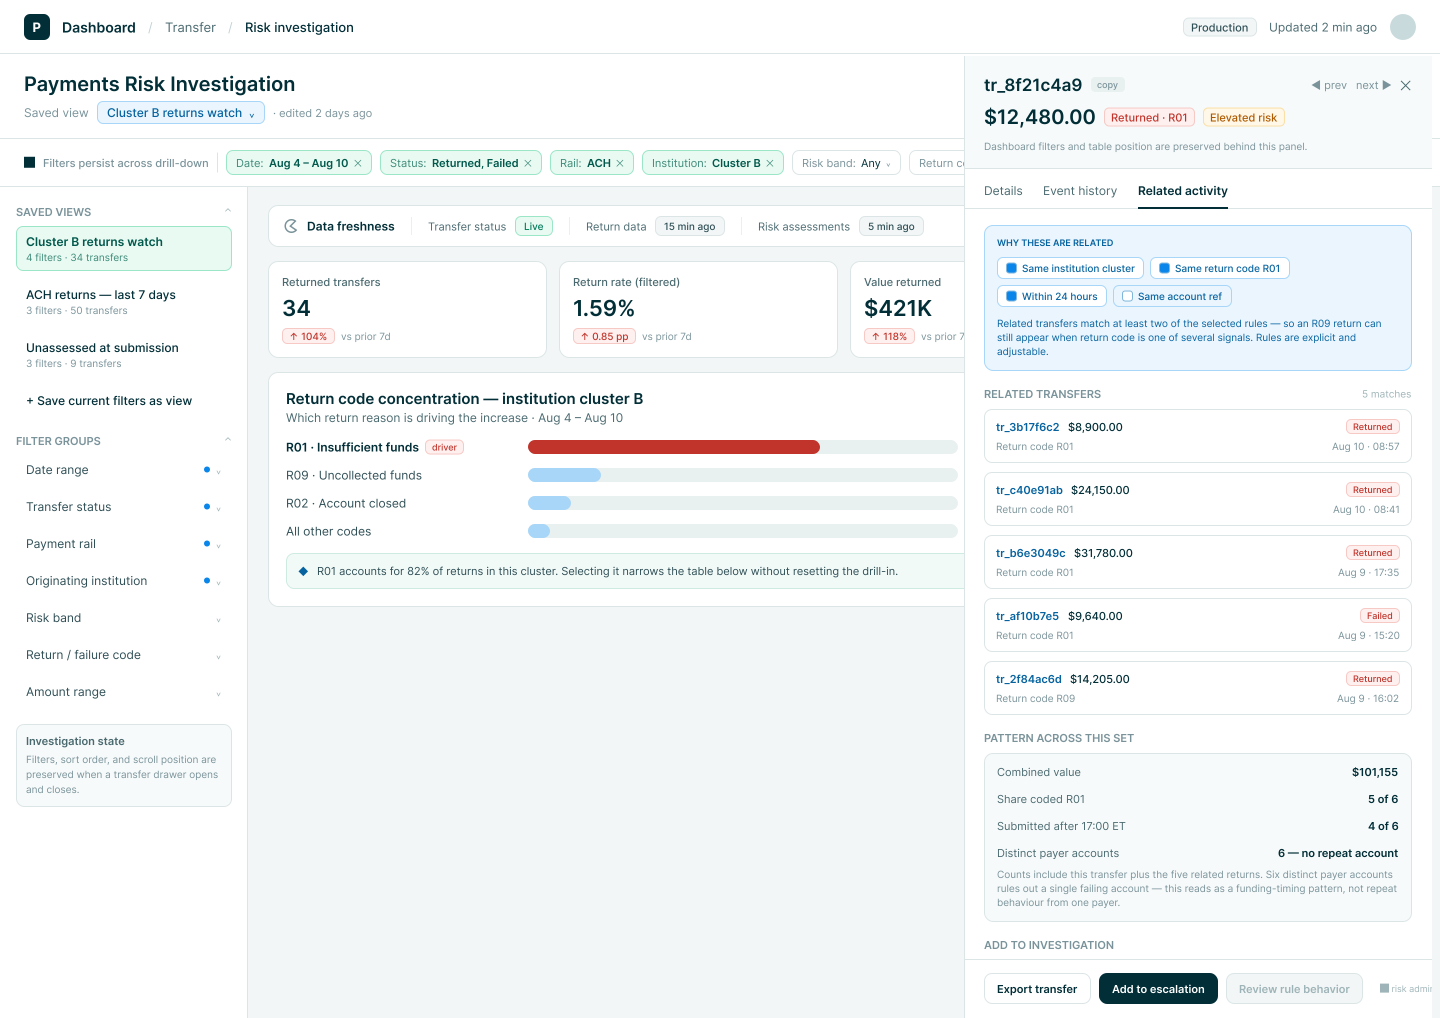
Related activity with explainable criteria
Related transactions are surfaced using visible criteria such as institution cluster, return code, and time window. Analysts can understand why records are being grouped together rather than relying on an unexplained recommendation.
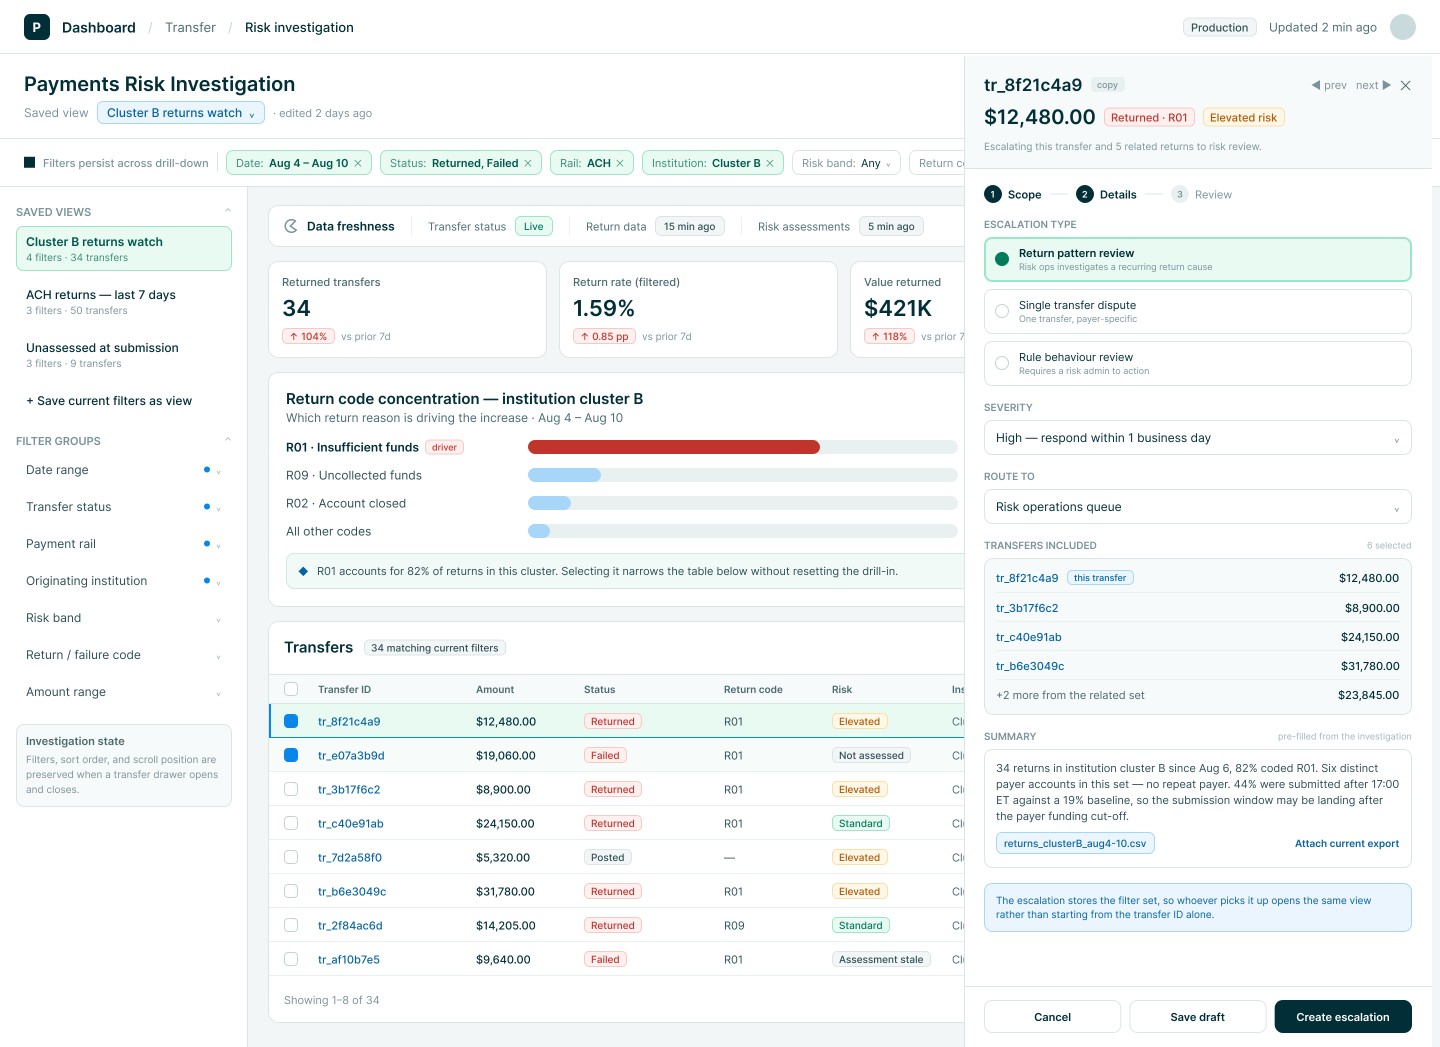
Escalate the investigation, not just one transaction
Escalation includes the investigation summary, relevant transactions, and the active filter set. The next person can reopen the same investigation context instead of receiving an isolated transaction ID.
The states
Designing the non-happy paths was critical because payment data can be delayed, incomplete, stale, or unavailable.

Partial loading
Modules that have completed loading remain usable while dependent analytical content continues to resolve. Layout and chart structure remain stable during the process so temporary loading behavior is not mistaken for real data movement.

Stale data and failed refresh
When part of the dashboard fails to refresh, the interface identifies the last successful update and marks only the affected information as stale. Unaffected data remains available, while messaging explains which decisions should not rely on the outdated values.
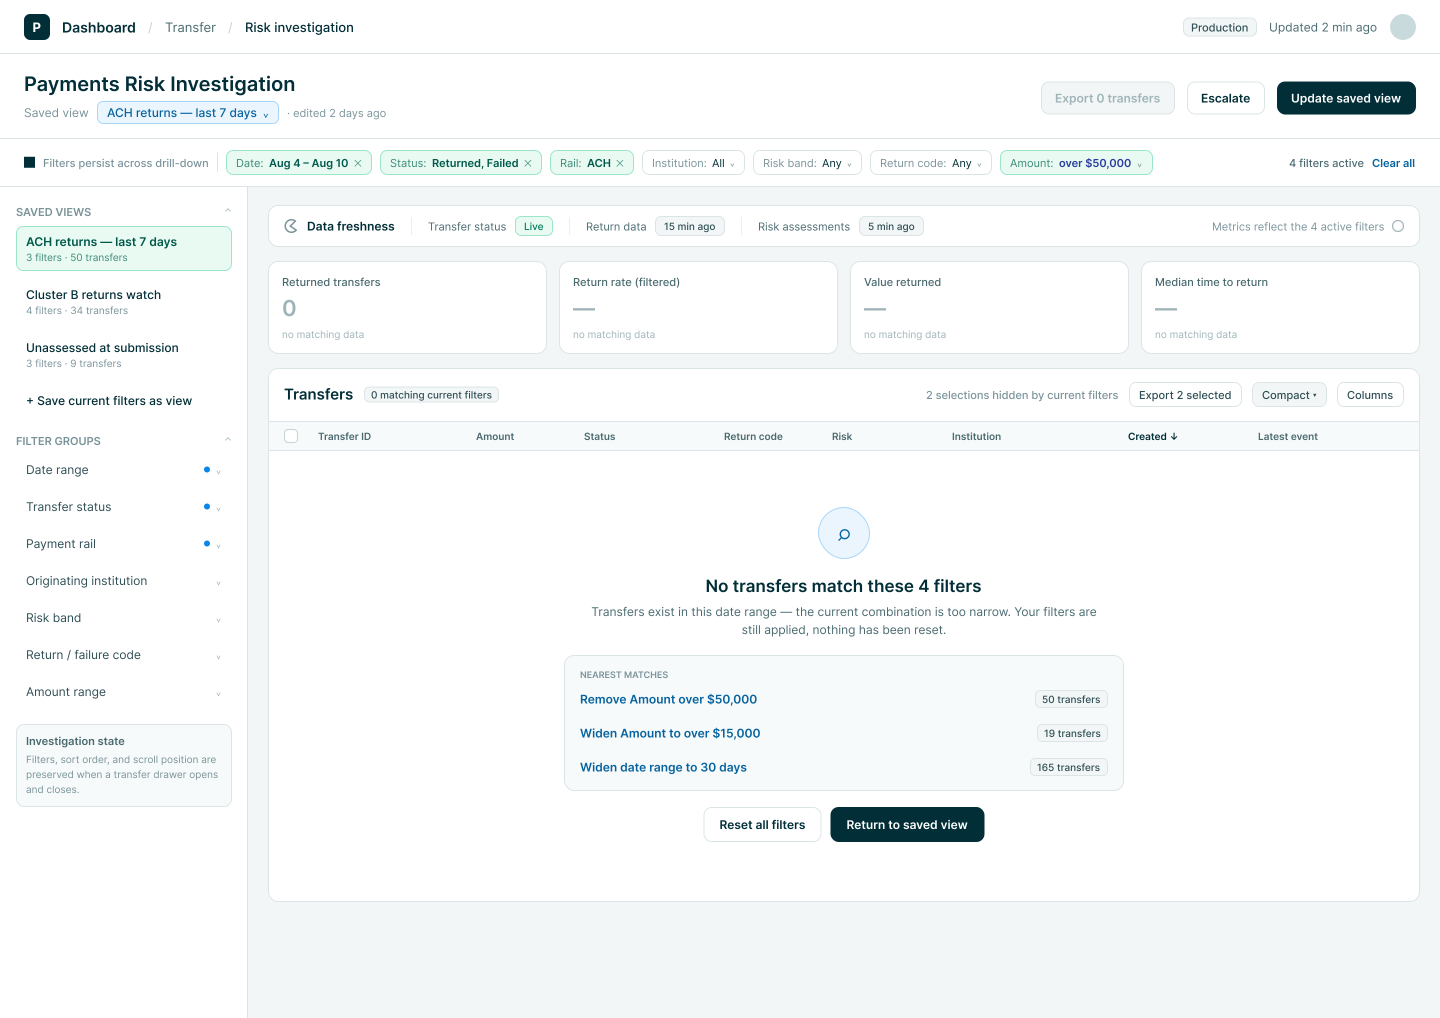
No results for the current filters
The active filters remain visible and the interface suggests specific ways to broaden the investigation, including the number of results each change would return. Analysts can decide which part of the hypothesis to relax without clearing their entire investigation.
Unavailable data should never be represented as a valid value. A failed metric is not 0%, an unavailable assessment is not low risk, and an incomplete period should not appear as a real decline.
Design system contribution
Reusing Plaid's existing patterns where possible and extending them where payment-risk workflows required additional states.

Patterns are identified as reused, adapted, or added so that the design-system contribution is clear and does not imply that existing components were recreated unnecessarily. Transfer-status badges remain tied to documented lifecycle states, while interface-generated conditions such as delayed refresh, stale assessment, or open return windows use a separate operational-state pattern. I worked with engineering to map these visible states to their underlying data behavior so users would not confuse an interface condition with an actual transaction lifecycle state.
Risk states follow the same principle. "Not assessed" and "not applicable" are represented neutrally rather than using the same treatment as low risk because the absence of an assessment should not communicate a positive risk decision.

Status colors are defined as foreground and background token pairs so accessibility is handled consistently at the system level. This also gives engineering named tokens to implement instead of relying on one-off color values from individual mockups.
End to end

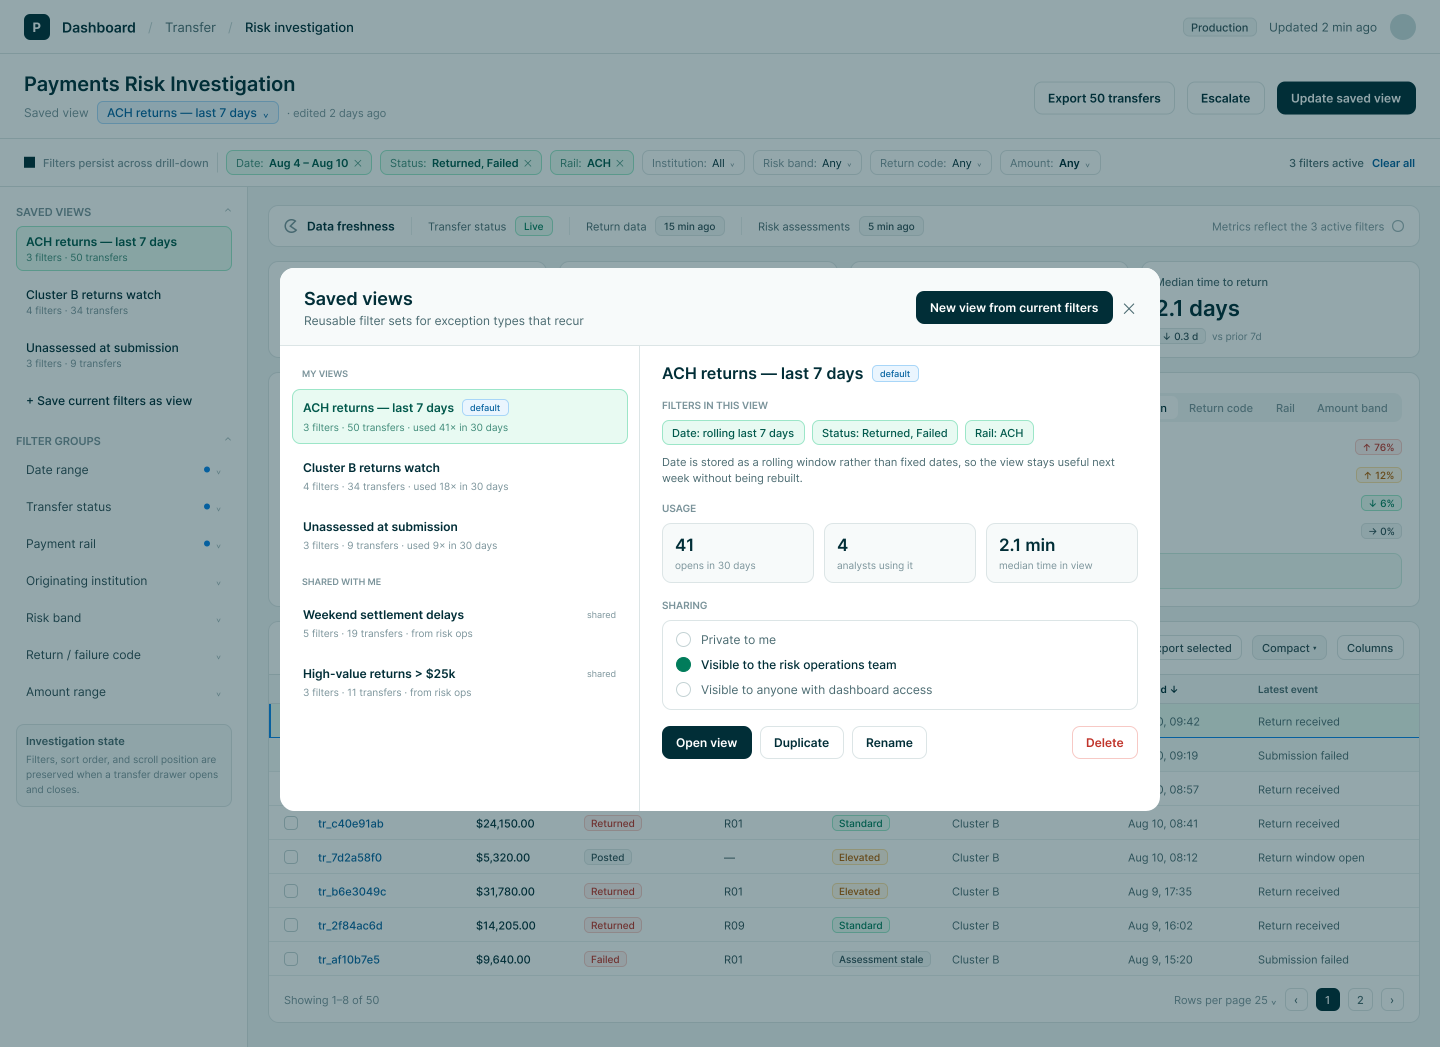
Saved views
Saved views preserve commonly used investigation configurations with rolling date ranges, allowing analysts to return to recurring workflows without rebuilding filters each time.
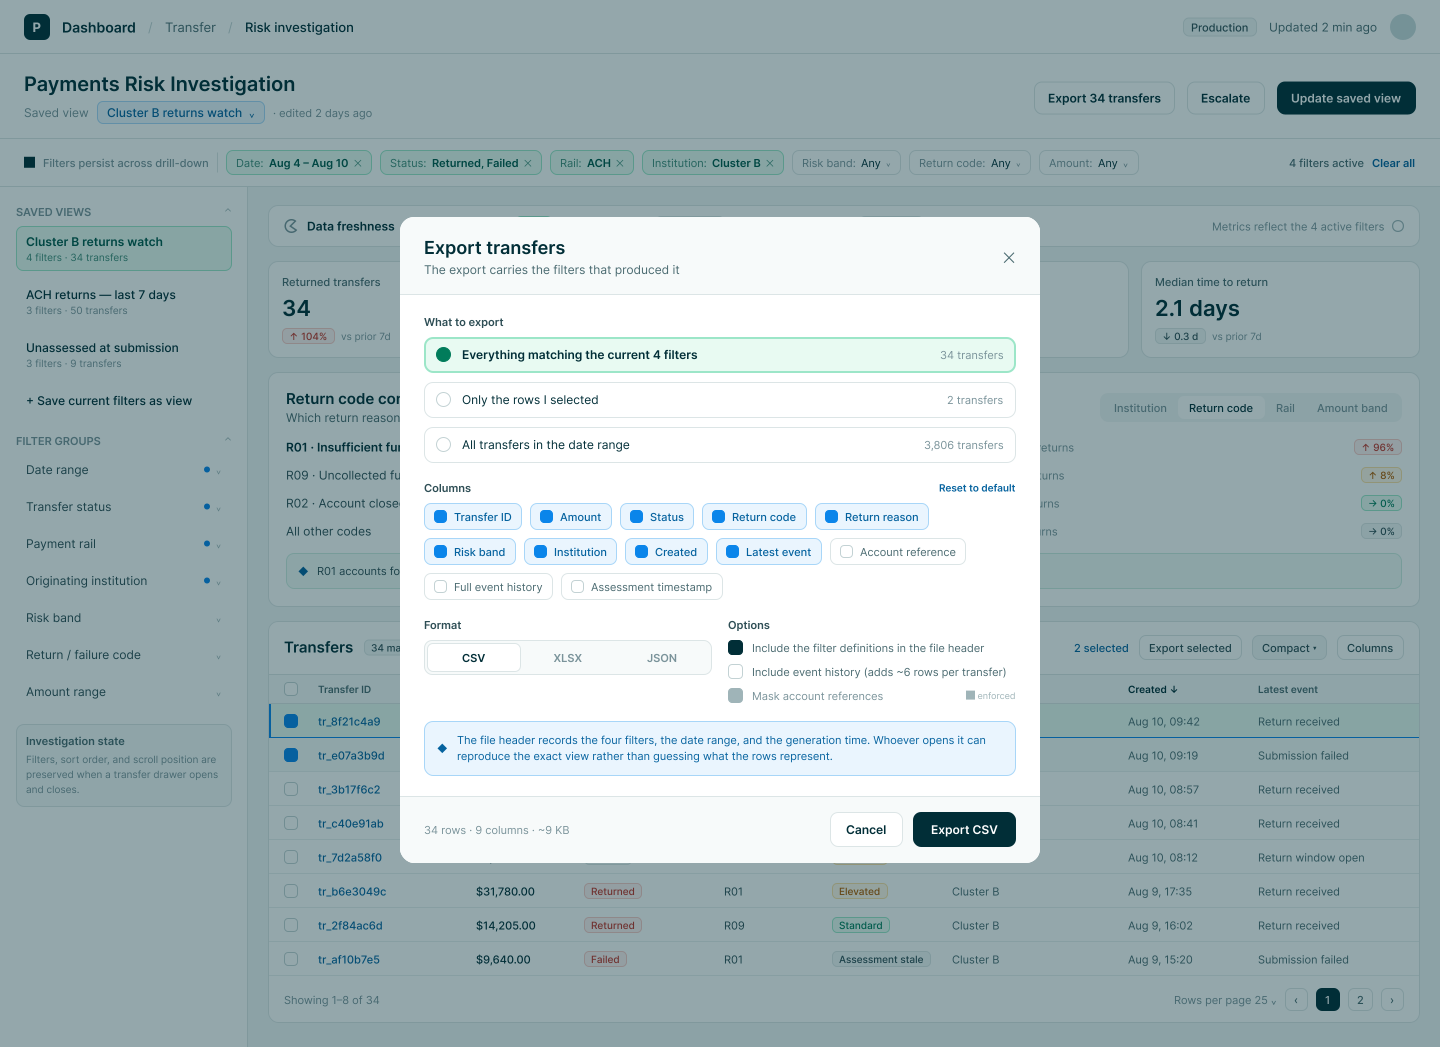
Export configuration
Exports include the active investigation context so recipients can understand which filters and scope produced the records in the file.
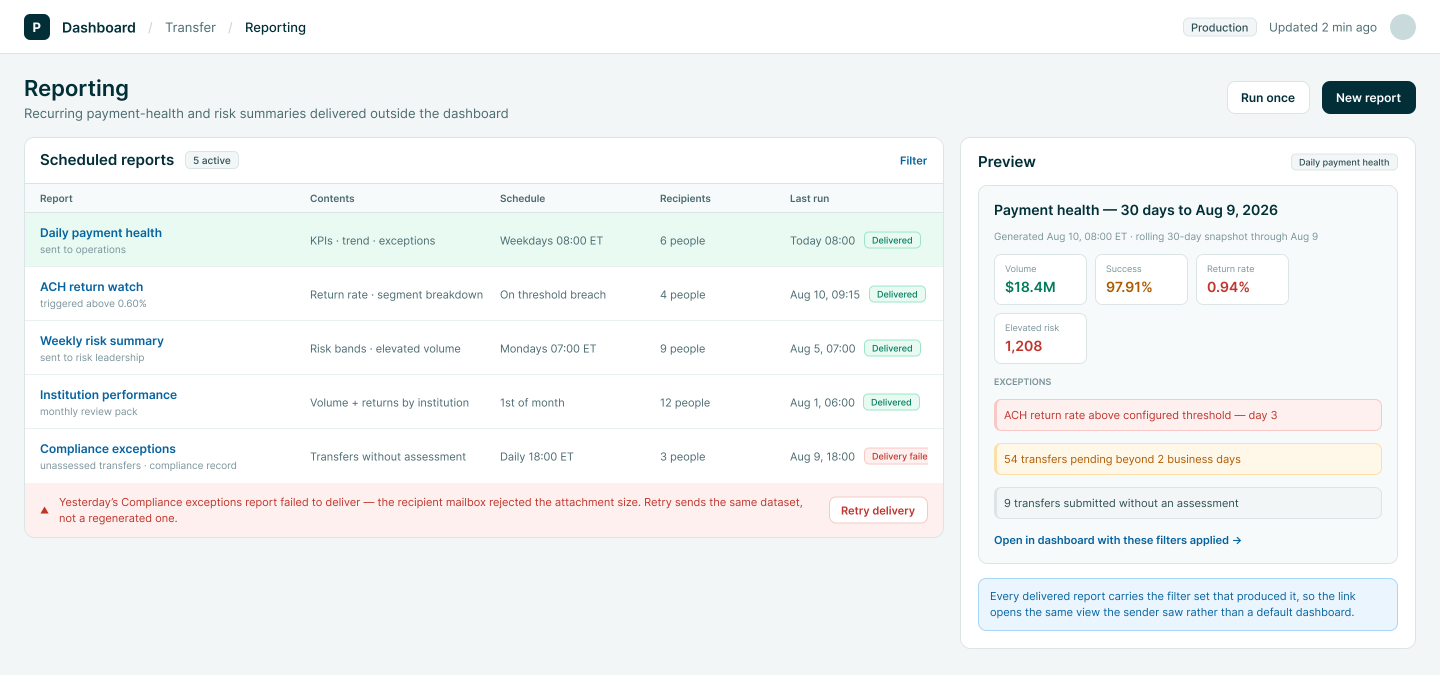
Scheduled reporting
Scheduled reports link back to the dashboard with the relevant filters already applied, allowing recipients to move directly from a summary into the underlying data.
Outcome
The redesign improved engagement by making meaningful workflows easier to enter and continue, rather than encouraging users to spend more time in the dashboard. Investigation time improved by reducing repeated filtering, preserving context through drill-downs, and making transaction, risk, and system-state information easier to interpret.
Identify the real unit of work
I initially focused on improving individual filtering interactions. Research showed that the more important problem was preserving the combination of filters that represented an investigation hypothesis. Treating that context as portable changed how I approached the entire workflow.
Design system states alongside the data model
Working with engineering to map visible UI states to their underlying data sources, fallbacks, and freshness expectations surfaced edge cases before implementation and helped create a clearer separation between transaction lifecycle states and operational interface states.
Make uncertainty visible
In payments tooling, missing and incomplete information can materially change how a user interprets a situation. Designing explicit states for unavailable, stale, partial, and failed data became just as important as designing the successful state.